In today’s energy landscape, the battle for profitability is no longer won just at the wellhead or the power plant. It is won in the complex, data-rich world of supply chain logistics.
For a leading national energy provider—a giant serving over 4 million customers with a diverse portfolio of generation, retail, and distribution assets—this reality was becoming increasingly clear. Despite their market leadership, a profound “digital divide” was silently eroding their operational efficiency and profit margins. This client is managing a sprawling network of commercial and retail fuel and LPG distribution across a continent. Their operations span from bulk fuel hauling for industrial clients to the last-mile delivery of propane to residential and commercial customers.
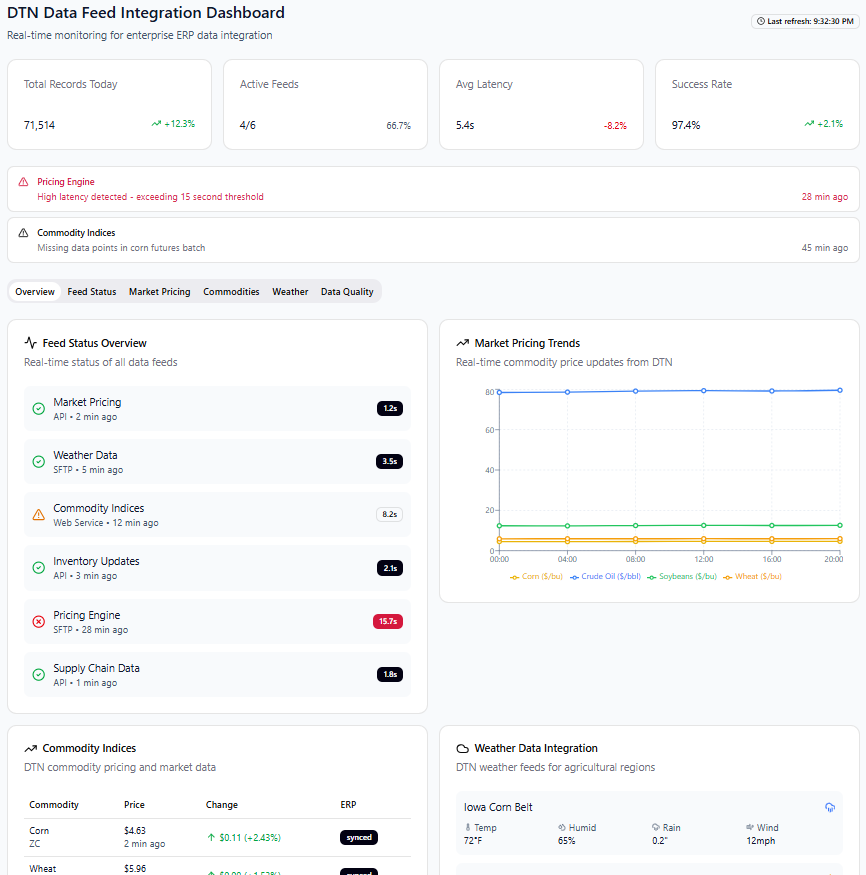
The company’s field operations were a hive of activity, generating a torrent of valuable data every second. Tank levels fluctuated, commodities prices shifted, and fleets of delivery trucks moved across the continent. This raw operational intelligence was captured by a disparate Data Transmission Network (DTN)—a mesh of IoT sensors, telematics units, and external market feeds. Yet, this critical information was trapped in isolated silos, disconnected from the corporate brain: their Enterprise Resource Planning (ERP) system.
The ERP, a legacy system of record, was blind to the real-time events unfolding in the field. It knew what had happened yesterday, but it had no idea what was happening now. This disconnect created a cascade of costly inefficiencies: a reactive logistics model plagued by emergency deliveries, a static pricing structure that lagged the market by days, and a back office that could only guess at the true profitability of a single customer. The nervous system and the brain were not communicating.
The company’s leadership recognized that to truly transform their business, they needed to do more than just upgrade software. They needed to forge a direct, high-fidelity link between their physical operations and their digital core. Their vision was to build a fully integrated ecosystem where data from their DTN would flow seamlessly into a unified ERP, transforming it from a passive ledger into a predictive, self-optimizing engine for the entire business. This is the story of how they bridged that divide.
Client: A leading integrated energy company
Industry: Energy Exploration, Production, Power Generation, and Retail
Size: 6,000 employees
Annual Revenue: ~ $13B USD
Customer Base: ~5 Million + (residential, small business, and large commercial and industrial clients)
Account types: Electricity, natural gas, LPG, and broadband
Location: Headquartered in a major metropolitan hub, with extensive operational assets across Australian continent.
Despite its market leadership, the company’s commercial fuel and LPG division was grappling with the operational growing pains of a legacy technology stack. Their systems had not kept pace with the complexity of their business, creating significant inefficiencies and financial leakage.
| Pain Point | Everyday Reality |
| Reactive and Inefficient Logistics | The division operated in a constant state of reaction. Emergency deliveries accounted for nearly 20% of total runs. These runs were 40% more expensive due to overtime pay and out-of-route mileage. Schedulers relied on a combination of customer calls, outdated spreadsheets, and static, manually planned routes that were planned the night before, with no ability to adapt to real-time events. |
| Static Pricing and Margin Erosion | In a volatile commodities market, pricing was updated via a manual, bi-weekly process. This 3-4 day lag in reacting to market volatility meant the company was consistently “behind the curve,” either losing bids to more agile competitors or sacrificing potential margin during price surges. |
| Data Silos and No Single Source of Truth | The logistics team used a legacy dispatch system, the finance team relied on an on-premise accounting system, and customer contracts were managed in a separate CRM. Reconciling a single customer’s profitability required manually exporting data from three different systems into a spreadsheet, a process that took days and was prone to errors. |
| Limited Fleet Visibility | Dispatchers operated with a “radio silence” model. Once a truck left the depot, its location was a mystery until the driver called in at the end of the day. This made it impossible to dynamically re-route for new high-priority orders or respond to unexpected traffic, leading to an average of 90 minutes of unproductive idle time per truck, per day. |
“Quantisage”, a specialized integration partner was engaged to implement a transformative solution centered on a best-in-class, unified Energy ERP platform. The strategy was not just to install new software, but to build a fully integrated ecosystem, connecting the platform to the critical data sources that drive the business.
Phase 1: Establishing the Core with a Unified Platform The implementation began by deploying a cloud-native, end-to-end solution built on a robust Energy ERP System foundation. This immediately created the framework for a single source of truth, unifying customer data, financials, and operational logistics onto one platform and eliminating the reliance on supplemental systems.
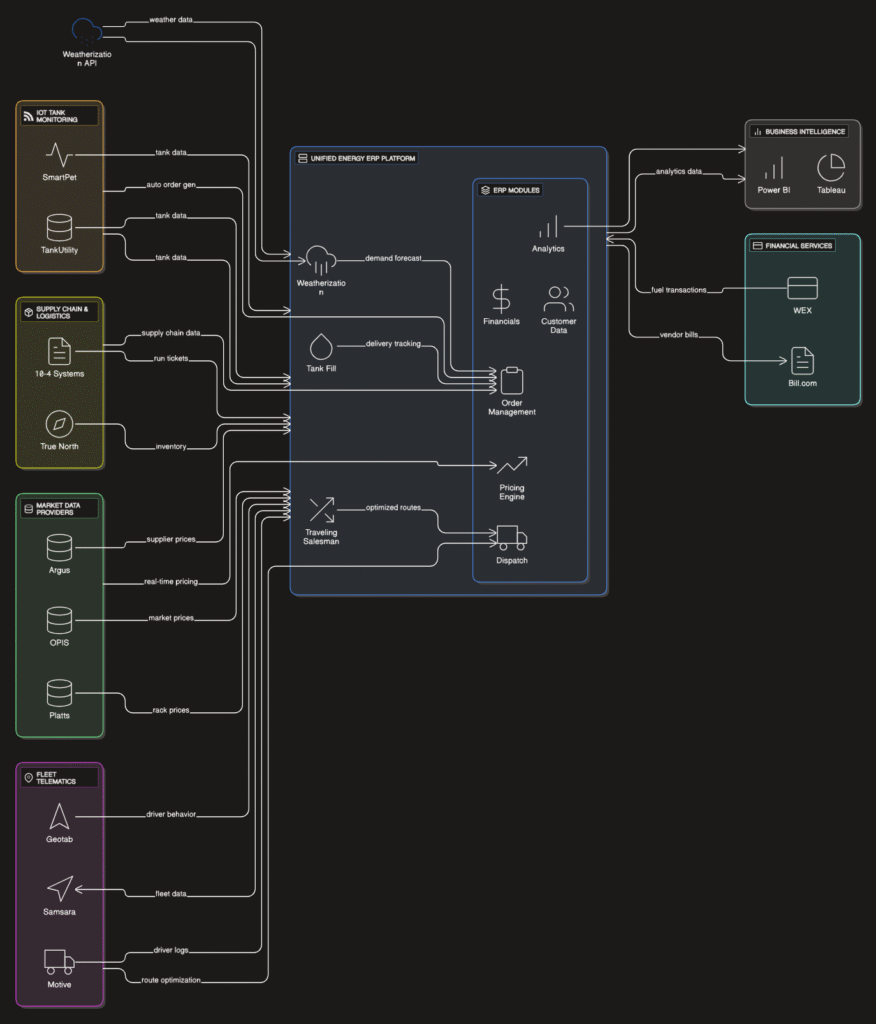
Phase 2: Integrating the Nervous System (The DTN) This is where the integration partner’s expertise turned the platform into a living, breathing system. They built a Data Transmission Network by integrating best-in-class third-party systems directly into the platform’s workflows.
The integration of the unified platform with its ecosystem of data sources delivered a transformational impact on the company’s operations and bottom line.
| Integration | Key Tracking Attributes | KPI Impact |
| Unified Energy ERP Platform | Customer ID, Sales Order #, GL Journal Entry | Single Source of Truth, Month-End Close Time ↓ |
| IoT Tank Monitoring | Device ID, Calculated Gallons, Battery Voltage | Emergency Deliveries ↓, Customer Retention ↑ |
| Market Data (OPIS-like) | Product Code, Rack Price, Effective Timestamp | Gross Margin ↑, Pricing Accuracy ↑ |
| Fleet Telematics | Vehicle ID, GPS Lat/Long, Engine Hours | Deliveries/Day ↑, Fuel Costs ↓, Overtime ↓ |
| Weatherization API | Customer Location, Forecasted Temp, Wind Chill | Forecast Accuracy ↑, Proactive Service ↑ |
| Power BI (Analytics) | Route Profitability, Customer Margin, Fleet Utilization | Data-Driven Decisions, Strategic Insight |
| System | High-Level Use Case | Key Tracking Attributes |
| OPIS | Automatically adjust customer fuel prices in real-time based on live market data to protect and maximize profit margins. | Inbound to Energy ERP: • Product Code (e.g., Propane, Diesel)• Price per Gallon • Price Index Name (e.g., OPIS Rack, OPIS Wholesale) • Effective Date/Timestamp• Location/City Code • Currency |
| Platts | Incur daily rack prices into the ERP to ensure wholesale costing is always accurate and reflective of the market. | Inbound to Energy ERP: • Product Code • Rack Price • Terminal/Location ID • Publication Date • Pricing Basis (e.g., FOB, Delivered) |
| Argus | Streamline bulk fuel purchasing by automating the procurement process based on real-time supplier price feeds. | Inbound to Energy ERP: • Supplier ID • Product Code • Spot Price • Bid/Ask Spread • Timestamp • Volume Tiers |
| System | High-Level Use Case | Key Tracking Attributes |
| Samsara | Gain real-time visibility into the entire fleet, optimize routes dynamically, and trigger maintenance alerts based on vehicle diagnostics. | Inbound to Energy ERP: • Vehicle ID • GPS Latitude/Longitude • Timestamp • Vehicle Status (Moving, Idling, Stopped) • Engine Hours • DTC/Fault Codes Outbound from Energy ERP: • Optimized Route Data • Stop Sequence • Customer Address |
| Geotab | Improve driver safety and reduce fuel costs by monitoring driver behavior and vehicle performance data directly within the dispatch platform. | Inbound to Energy ERP: • Driver ID • Speeding Events • Harsh Braking/Acceleration • Seatbelt Status • Fuel Consumption Rate |
| Motive | Ensure Hours of Service (HOS) compliance and simplify payroll by automatically integrating driver logs from the ELD into the ERP payroll module. | Inbound to Energy ERP: • Driver ID • Duty Status (On-Duty, Off-Duty, Driving) • Hours Remaining • Location at Status Change • Daily Log Certification |
| • Daily Log Certification |
| System | High-Level Use Case | Key Tracking Attributes |
| 10-4 Systems | Automate the creation of electronic run tickets and track rail car assets to create a seamless digital chain of custody from supply to customer. | Inbound to Energy ERP: • Run Ticket ID • Bill of Lading (BOL) # • Product • Net Volume • Temperature • Rail Car ID • Timestamp |
| True North | Gain comprehensive visibility into bulk plant inventory and terminal operations to optimize supply planning and prevent stockouts. | Inbound to Energy ERP: • Terminal ID • Tank ID • Gallons on Hand • Tank Capacity • Product • Last Reading Timestamp |
| System | High-Level Use Case | Key Tracking Attributes |
| TankUtility | Use remote tank level sensors to forecast customer demand and automatically generate delivery orders, eliminating run-outs and costly emergency calls. | Inbound to Energy ERP: • Sensor/Device ID • Customer ID • Tank Capacity • Current Depth/Level • Calculated Gallons • Battery Voltage |
| SmartPet | Provide enterprise-level, sonar-based monitoring for large commercial and industrial tanks to ensure just-in-time bulk fuel deliveries. | Inbound to Energy ERP: • Device ID • Asset Tag • Raw Reading • Adjusted Volume • Sensor Health Status |
| System | High-Level Use Case | Key Tracking Attributes |
| WEX | Automatically reconcile fleet fuel card transactions and streamline driver expense management to control costs and simplify accounting. | Inbound to Energy ERP: • Transaction ID • Driver ID • Date/Time • Merchant • Product • Gallons • Total Cost |
| Bill.com | Automate the accounts payable process by syncing vendor bills from ERP for approval and payment, improving cash flow management. | Outbound from Energy ERP: • Vendor ID • Invoice # • Due Date • Amount Due • Invoice PDF/Image |
| System | High-Level Use Case | Key Tracking Attributes |
| Power BI | Develop interactive dashboards that combine financial and operational data to analyze route profitability and make data-driven decisions. | Data Pulled from Energy ERP: • Customer Name • Product • Revenue • Cost of Goods Sold • Profit Margin • Delivery Date • Driver ID |
| Tableau | Visualize complex supply chain and logistics data to identify bottlenecks, track KPIs, and uncover opportunities for efficiency gains. | Data Pulled from Energy ERP: • Truck ID • Miles per Gallon • Stops per Hour • Average Delivery Time • On-Time Delivery % |
| Concept / System | High-Level Use Case | Key Tracking Attributes |
| Traveling Salesman(Routing Algorithm) | Solve the “shortest possible route” problem to minimize travel time and fuel costs for a set of deliveries. | Attributes Used by Algorithm: • Starting Depot • List of Stop Addresses • Stop Time Windows • Vehicle Capacity • Service Time per Stop |
| Tank Fill(Business Process) | Automate and record the process of filling a customer’s tank to ensure accurate delivery and inventory tracking. | Attributes Tracked in Energy ERP: • Tank ID • Starting Gallons • Ending Gallons • Delivered Gallons • Meter Start/End • Timestamp |
| Weatherization(Forecasting API) | Adjust demand forecasts and delivery schedules based on hyper-local weather predictions to proactively manage supply. | Inbound to Energy ERP: • Customer Location (Lat/Long) • Temperature • Feels-Like Temp (Wind Chill) • Humidity • Forecasted Temp (24/48hrs) • Weather Condition (Snow, Rain) |
“Our vision was to create a seamless link between our field operations and our financial core. This partnership was instrumental in bringing that vision to life which helped us build a system that truly harnesses our Data Transmission Network (DTN), turning real-time data from our sensors and fleet into automated, intelligent actions. It’s been a true collaboration that has transformed our supply chain into a predictive, highly efficient engine for the entire business.”
— Senior Data Engineer, National Energy Provider
We have the experience, knowledge, and flexibility to help you with business transformation, hybrid workplace strategy, technology implementation and adoption, and more.
Join the like minded community and get the latest updates and news on business, technology and digital to help improve your business.
